A Detailed Look Into the first 33 games for the Glacier Kings (2025-26)
First Half Summary (Games 1–16)
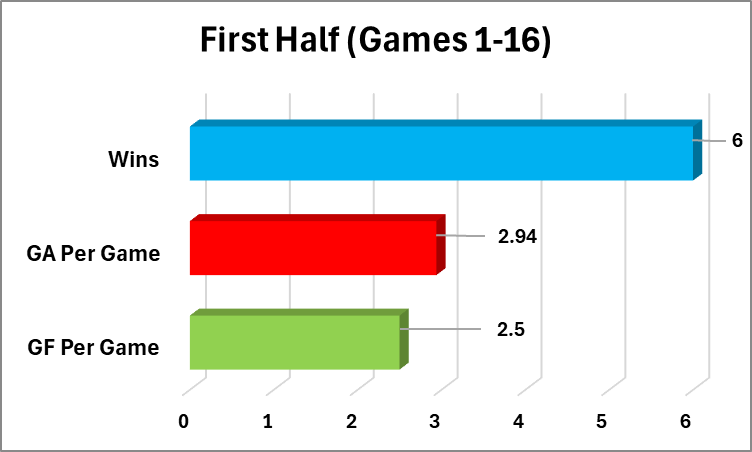
The opening stretch was a grind. Through the first 16 games, the Glacier Kings struggled to find consistent offense while keeping games relatively tight defensively.
- Goals For Per Game: 2.50
- Goals Against Per Game: 2.94
- Wins: 6
This period included several close contests but also a few missed opportunities to climb the standings. The offense averaged just over two and a half goals per game, while the defense kept things respectable under three goals against per game.
Chart: First Half Performance

Second Half Surge (Games 17–33)
The next 17 games told a different story. The Glacier Kings’ offense woke up, scoring at a much higher clip, but defensive consistency slipped.
- Goals For Per Game: 3.59
- Goals Against Per Game: 4.12
- Wins: 10
This surge included big wins and high-scoring affairs, but also some tough nights where goals against ballooned. Still, the team managed to nearly double its win total compared to the first half.
Chart: Second Half Performance (Including All Games)

The Peninsula Factor
Two games against the Peninsula Panthers stand out: an 11–1 loss on Nov 1 and a 9–2 loss on Nov 22. These outliers heavily skew the second-half defensive numbers. Remove those two contests, and the picture changes dramatically:
- Goals For Per Game: 3.87
- Goals Against Per Game: 3.33
Without those blowouts, the Glacier Kings’ second-half profile looks far more balanced—stronger offense and a defense closer to league average.
Chart: Second Half Adjusted (Peninsula Games Removed)

Leave a Reply